Source: Delaware Department of Elections, unofficial results — https://elections.delaware.gov/results/enr/GE2026.html
Data as of: 11/03/2026 9:40 PM ET · Checked: 9:44–9:49 PM ET, Nov. 3, 2026 (live read of the official page; candidate names transcribed character-for-character as printed)
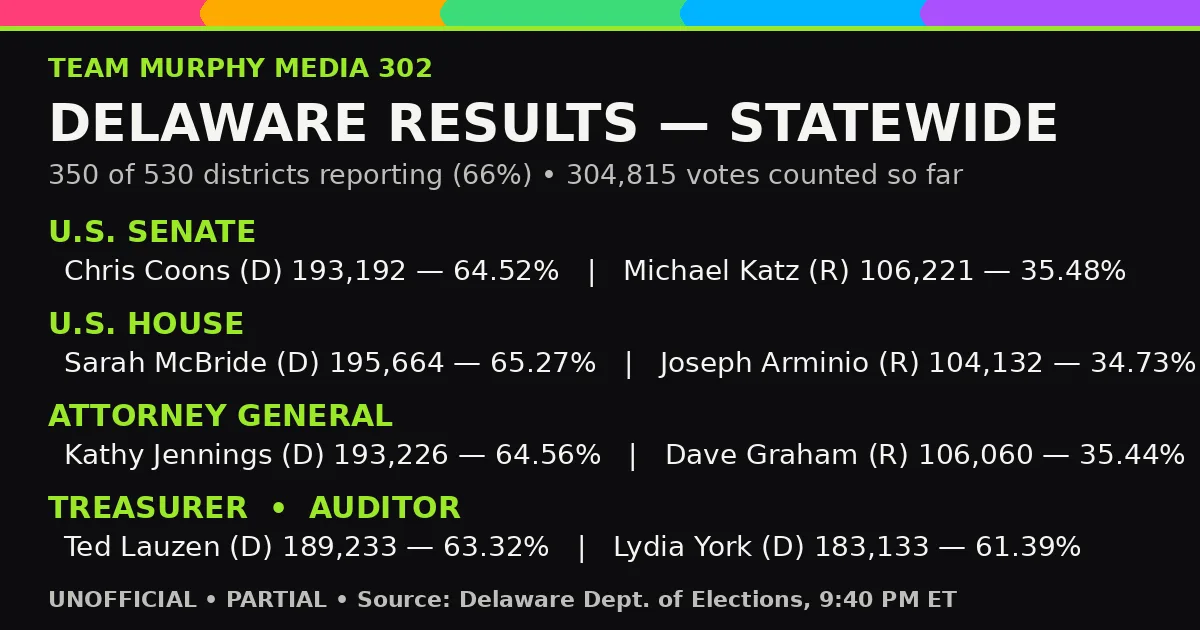
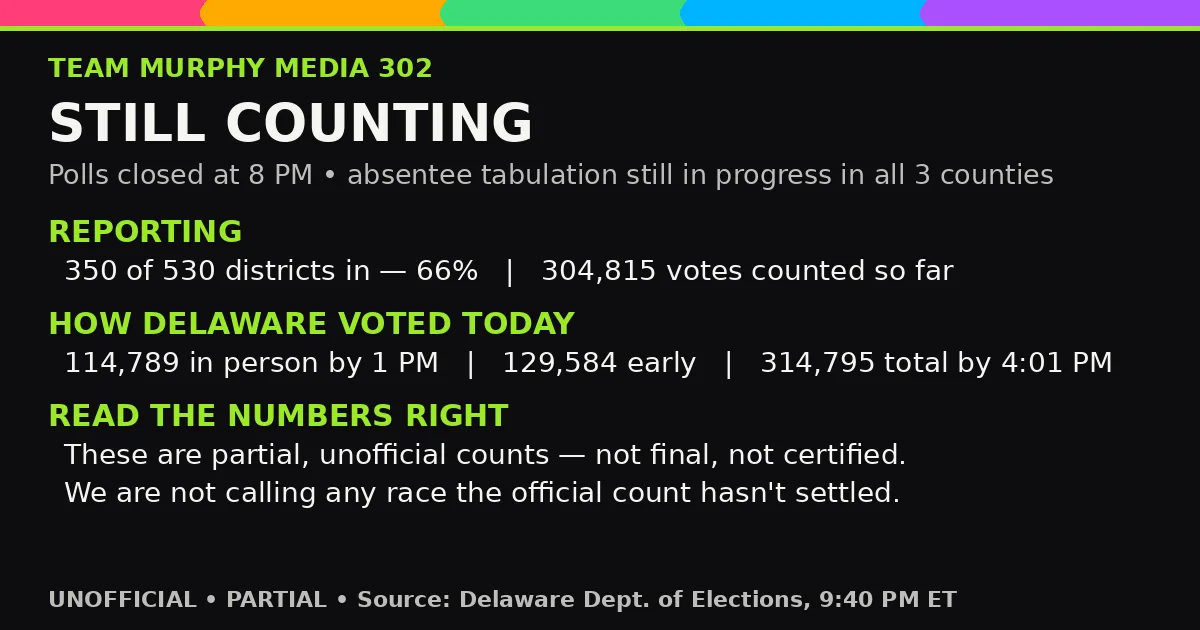
Reporting: 350 of 530 election districts reporting — 66%
Total votes cast (counted so far): 304,815 of 810,407 registered voters — 37.61%
Absentee tabulation: In progress in all three counties (New Castle, Kent, Sussex) — last reviewed 11/03/2026 8:15 PM on the page's status section
Status of these numbers: Unofficial and partial. Nothing here is final or certified. The Department of Elections does not "call" races; leaders below are leaders in the count so far. Media projections are noted separately and are not the official count.
Statewide
| Race | Candidate | Party | Votes | % |
|---|---|---|---|---|
| U.S. Senator | Chris Coons | DEM | 193,192 | 64.52% |
| U.S. Senator | Michael "Dr. Mike" Katz | REP | 106,221 | 35.48% |
| Representative in Congress | Sarah McBride | DEM | 195,664 | 65.27% |
| Representative in Congress | Joseph "Dr. Joe" Arminio | REP | 104,132 | 34.73% |
| Attorney General | Kathy Jennings | DEM | 193,226 | 64.56% |
| Attorney General | David C. "Dave" Graham | REP | 106,060 | 35.44% |
| State Treasurer | Ted Lauzen | DEM | 189,233 | 63.32% |
| State Treasurer | Michael Ramone | REP | 109,636 | 36.68% |
| Auditor of Accounts | Lydia York | DEM | 183,133 | 61.39% |
| Auditor of Accounts | April Callaway | REP | 101,016 | 33.86% |
| Auditor of Accounts | Austin Cassidy | Independent Party of Delaware | 14,169 | 4.75% |
Vote-type detail (Machine / Absentee / Early) for statewide races, as printed: Coons 93,514 / 15,867 / 83,811 · Katz 57,653 / 4,430 / 44,138 · McBride 94,720 / 16,035 / 84,909 · Arminio 56,302 / 4,393 / 43,437 · Jennings 93,815 / 15,405 / 84,006 · Graham 57,234 / 4,419 / 44,407 · Lauzen 91,688 / 15,046 / 82,499 · Ramone 59,058 / 4,819 / 45,759 · York 87,977 / 14,524 / 80,632 · Callaway 53,446 / 4,260 / 43,310 · Cassidy 9,112 / 1,005 / 4,052.
Media projections (NOT official counts): AP, CNN and ABC projected Chris Coons (U.S. Senate) and Sarah McBride (U.S. House) as winners shortly after the 8 p.m. poll close (Delaware Online live coverage, 8:13 p.m. and 9:05 p.m. entries). The official partial count above is consistent with those projections in direction, but the projections themselves are media calls, not Department of Elections results.
Smyrna / Kent County focus races
| Race | Candidate | Party | Votes | % |
|---|---|---|---|---|
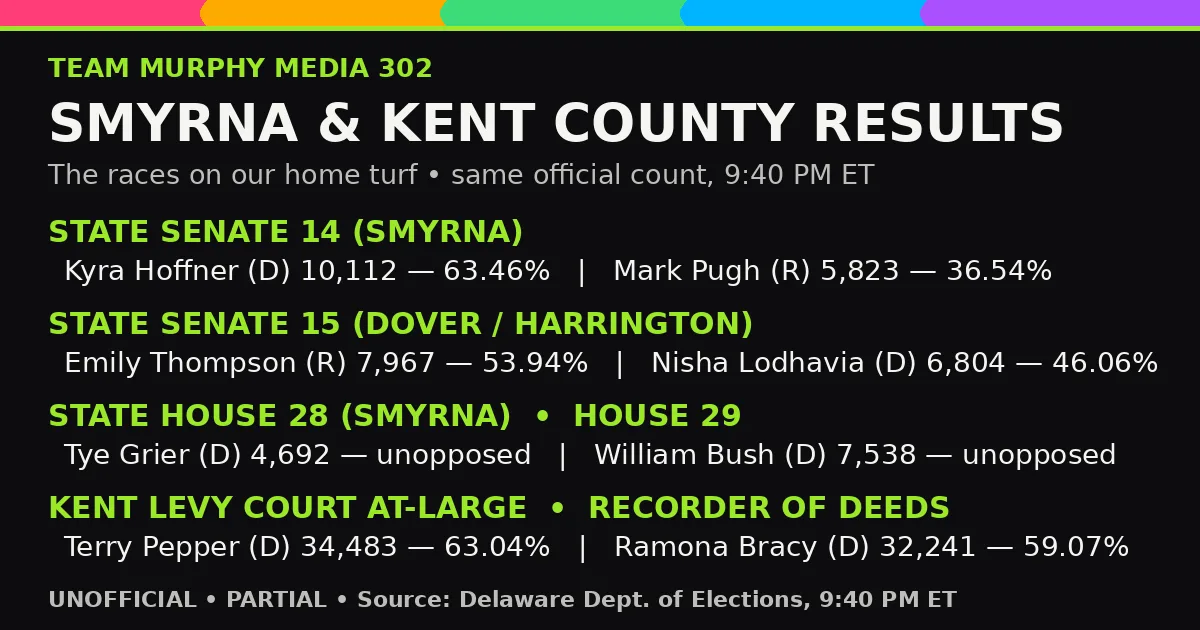
| State Senator District 14 | Kyra L. Hoffner | DEM | 10,112 | 63.46% |
| State Senator District 14 | Mark Pugh | REP | 5,823 | 36.54% |
| State Senator District 15 | Emily A. Thompson | REP | 7,967 | 53.94% |
| State Senator District 15 | Nisha Lodhavia | DEM | 6,804 | 46.06% |
| State Representative District 28 | Tyeisha "Tye" Grier | DEM | 4,692 | 100% (only candidate) |
| State Representative District 29 | William Bush | DEM | 7,538 | 100% (only candidate) |
| State Representative District 11 | Jeffrey N. Spiegelman | REP | 2,901 | 58.8% |
| State Representative District 11 | Tori Parker | DEM | 2,033 | 41.2% |
| Kent Co. Levy Court At-Large | Terry L. Pepper | DEM | 34,483 | 63.04% |
| Kent Co. Levy Court At-Large | Frank E. Coleman | REP | 20,221 | 36.96% |
| Kent Co. Recorder of Deeds | Ramona Bracy | DEM | 32,241 | 59.07% |
| Kent Co. Recorder of Deeds | Eugenia Thornton | REP | 22,336 | 40.93% |
| Kent Co. Sheriff | Norman R. Barlow | REP | 29,546 | 100% (only candidate) |
Cross-check: Delaware Online's 9:15 p.m. entry, citing the Department of Elections, had Senate District 15 at Thompson 53.68% / Lodhavia 46.32% as of 9 p.m. — consistent in direction and close in margin to the official 9:40 p.m. figures above (53.94% / 46.06%).
Kent Levy Court Districts 2 (Jeff Hall), 4 (Robert "Bobby" Scott) and 6 (Paul Hertz) were unopposed on the ballot per the Department of Elections filed-candidate list; their partial vote totals were not transcribed in the verified re-read and are omitted here rather than risk a wrong figure.
Turnout context (Department of Elections data, via Delaware Online live coverage, Nov. 3)
- 114,789 in-person votes by 1 p.m. (New Castle 69,291 · Sussex 25,887 · Kent 19,611)
- 129,584 early in-person votes cast before Election Day — more than double the 2022 midterms
- 314,795 total ballots by 4:01 p.m. (20,393 absentee · 129,584 early · 164,818 Election Day polling place) — Kent 51,462 · New Castle 159,774 · Sussex 103,559
- 342,839 voters checked in statewide by 6:11 p.m., of 810,407 registered voters
- Polls were open 7 a.m.–8 p.m.
Notes for the next update
- Remaining ~34% of districts plus unfinished absentee tabulation (all three counties still in progress) will move these numbers; closest local watch: Senate District 15 (1,163-vote gap at 9:40 p.m.).
- An earlier live read at 9:35 p.m. data (324 of 530 districts, 61%) returned systematically garbled candidate first names; that pass was discarded and every name and figure above comes from the character-for-character verification re-read at the 9:40 p.m. data timestamp, checked against the Department's filed-candidate list.
- Update this page when the official page reaches full district reporting; label any race final only when the Department's count is complete.